JA Stock Market Challege
UI/UX Design | Product Design
The JA Stock Market Challenge is a live, high-stakes simulation that teaches students the nuances of investing through an immersive, real-time trading experience. As the Lead Product Designer, I was responsible for redesigning the administrative user flows and core features to streamline complex backend operations. This work was driven by a deep dive into user feedback to identify friction points for those managing the simulations. I operated within a close-knit, cross-functional team, collaborating daily with developers and project managers, as well as the client’s Product Manager, to ensure the new designs met both technical requirements and strategic business goals.
Overview
Project Scope
Redesign and improve Admin userflows
Role
Art Director, Lead UI/UX Designer
Platforms
iOS, Windows, web app
Timeline
2 months
Tools
Figma, Illustrator, Photoshop
Status
Published
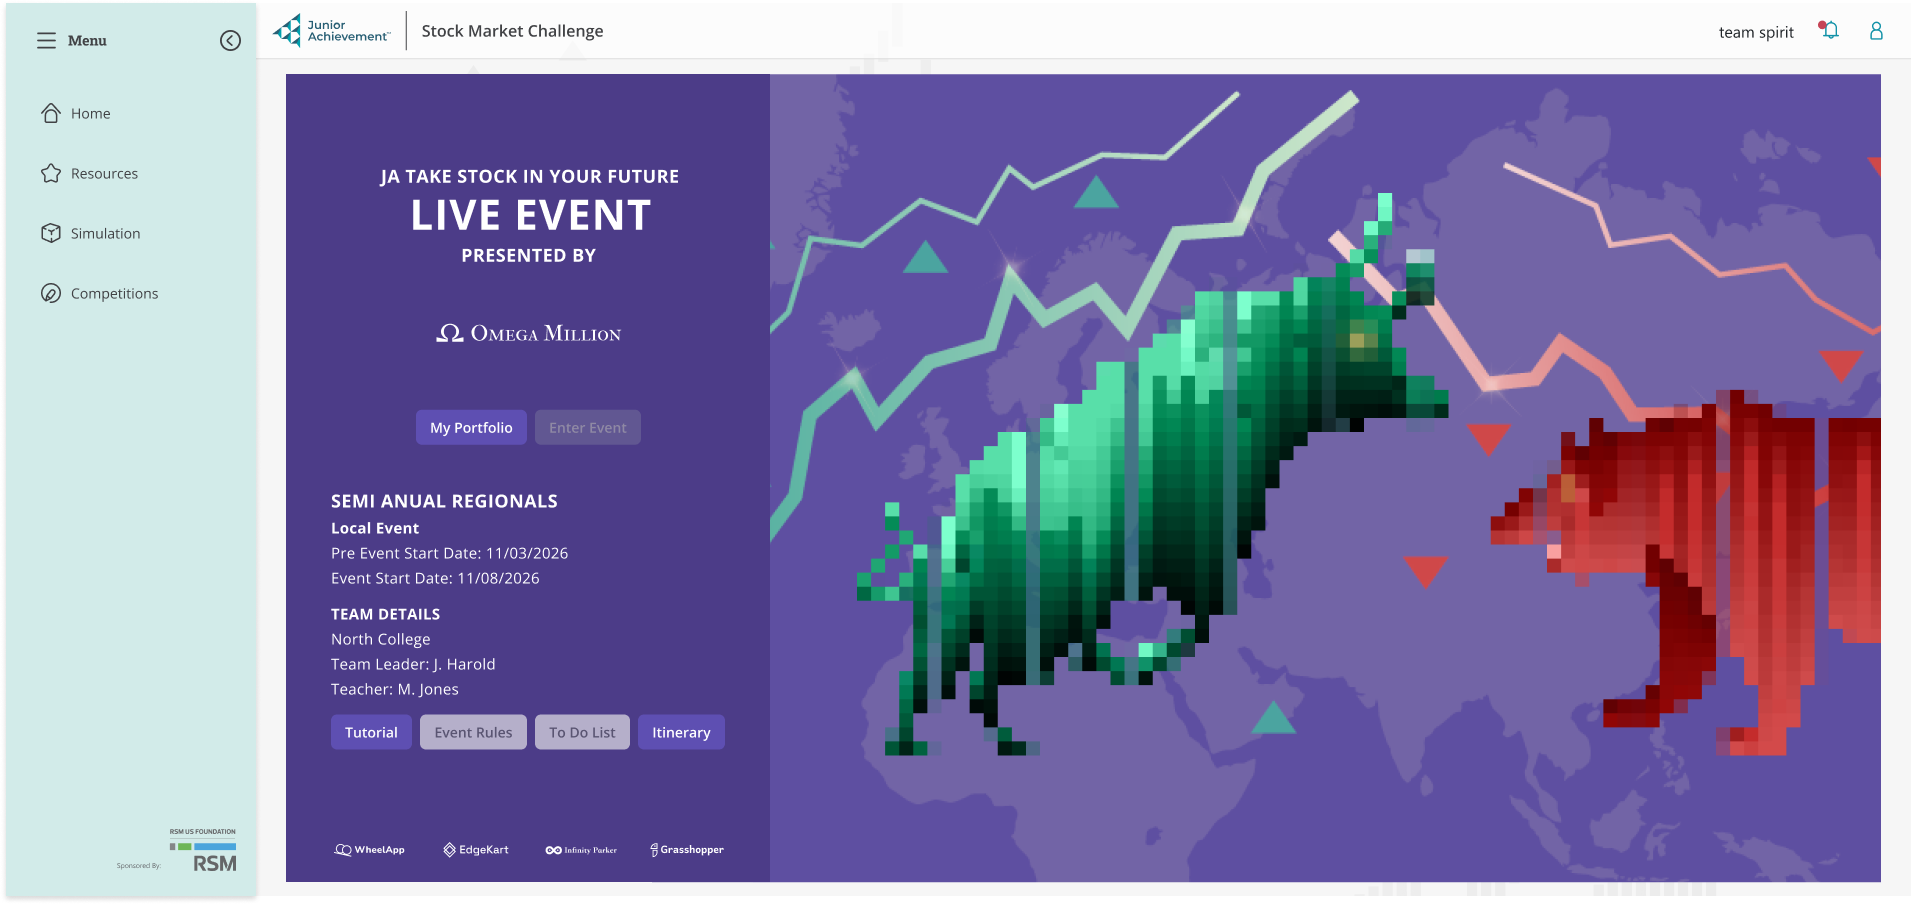
Background
The Junior Achievement Stock Market Challenge is an award-winning simulation where students compete in a high-energy, live environment to manage capital and test their financial acumen. While the competition involves multiple user types, this phase focused on the Administrative role. After several live sessions, the team identified significant opportunities to streamline the app experience. The goal was to transform a complex, high-pressure management process into a frictionless digital workflow, ensuring administrators could focus on the event's success rather than navigating technical hurdles.
The Challenge
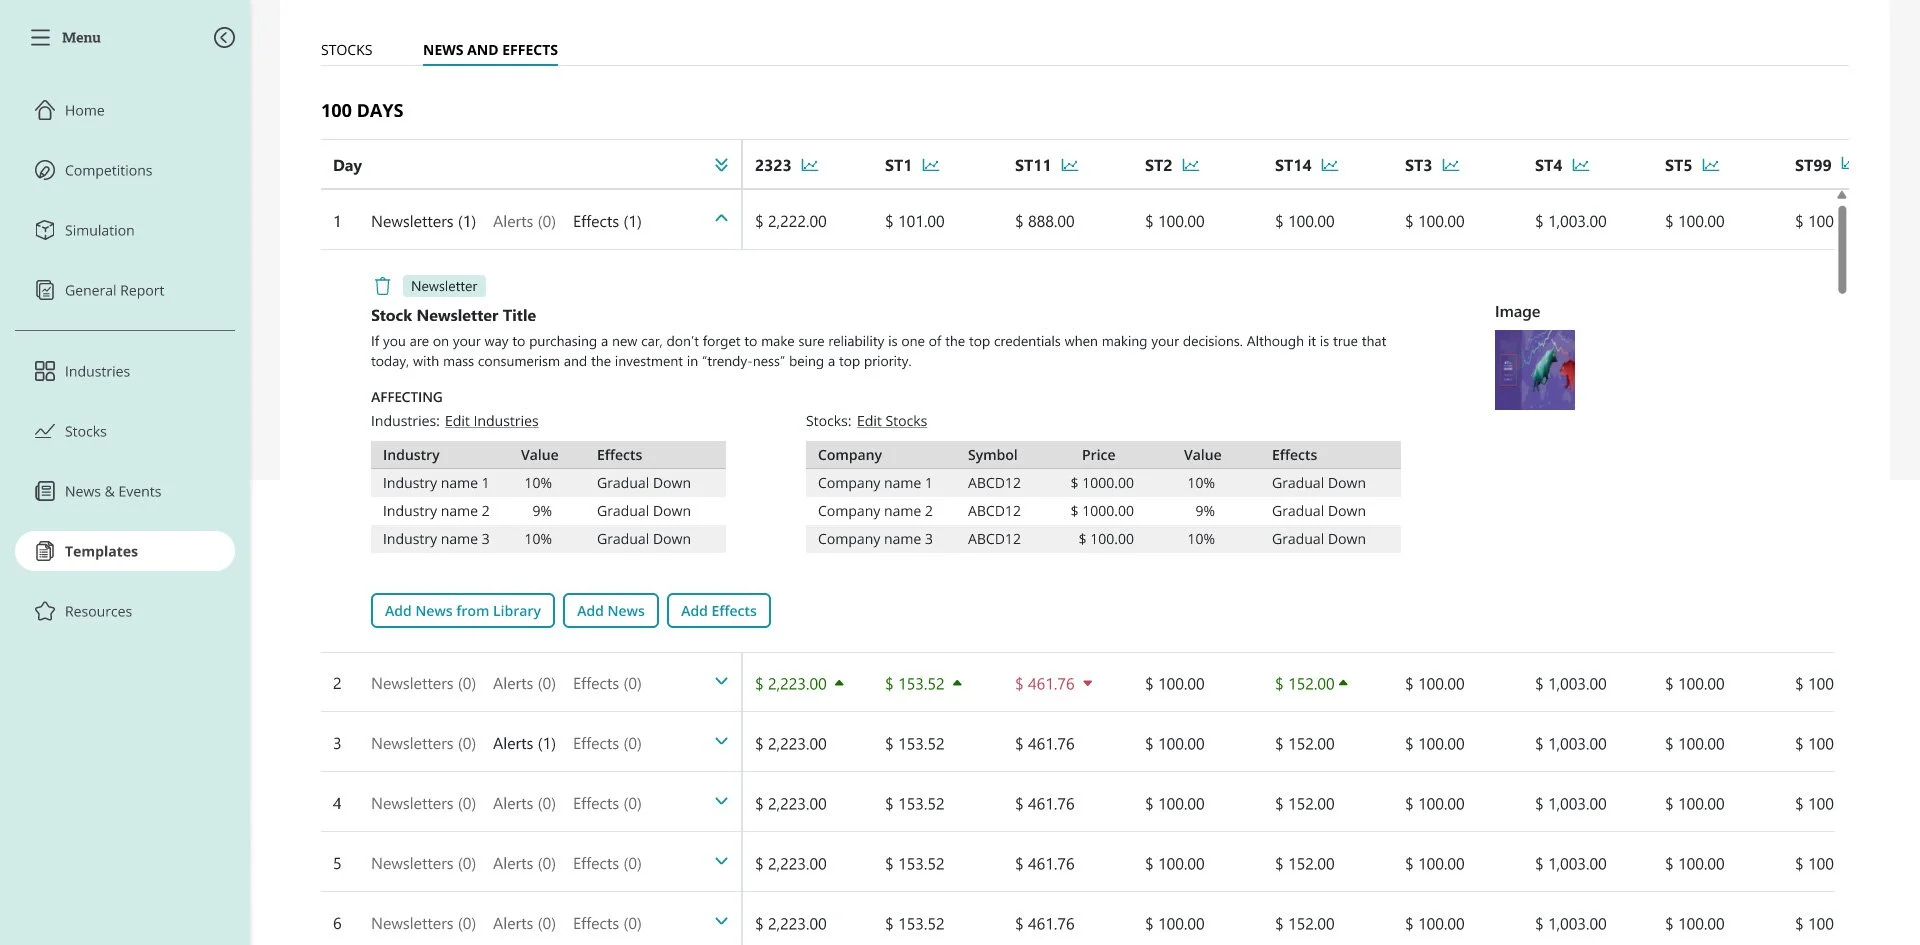
Administrators faced significant friction during high-stakes competition setup, largely due to exhaustive, time-consuming forms. Beyond simplifying these workflows, there was a critical need for granular customization—specifically the ability to trigger dynamic stock price effects.
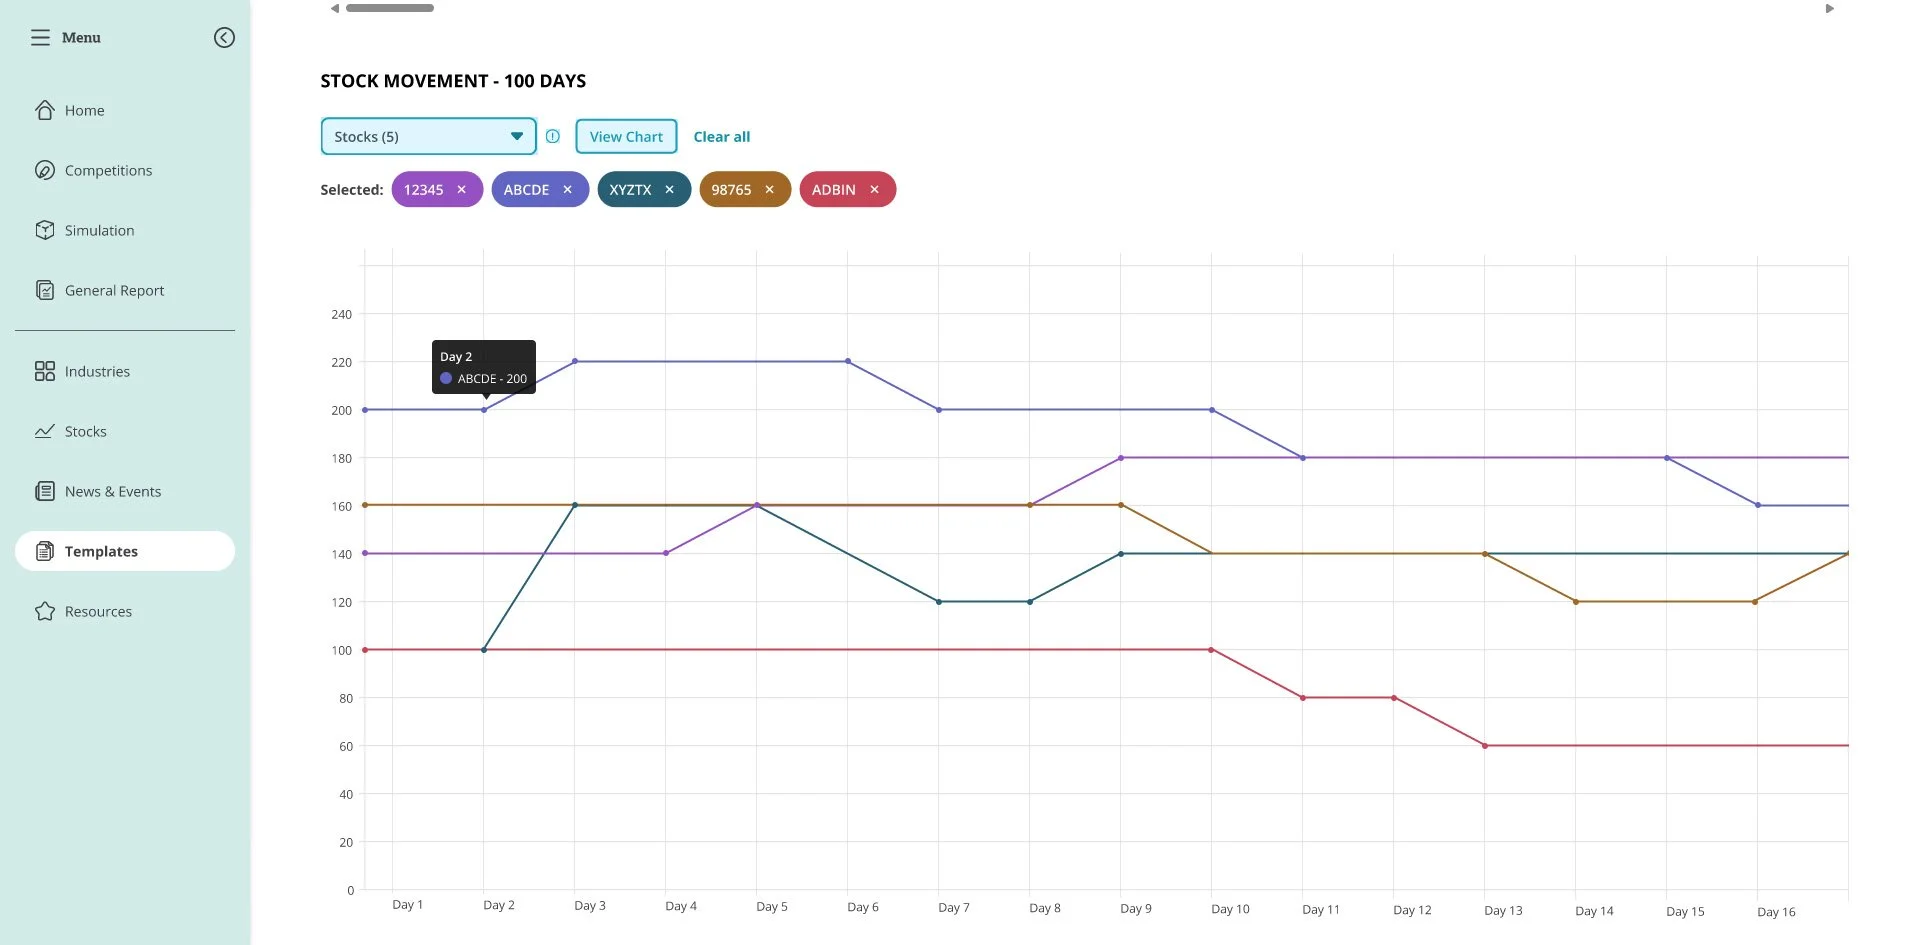
Most importantly, administrators required a centralized dashboard to visualize all market movements at a glance. This provided a comprehensive overview of the competition’s trajectory before launch, allowing them to validate that the volatility profile—whether aggressive, mild, or balanced—perfectly matched their pedagogical goals.
The Strategy
For the admin role, these were the objectives:
Objective 1: Streamline the "Pre-Competition" Orchestration
Focus: Reducing the friction of setup and data entry for stocks, news, and templates.
Key Result 1.1: Reduce the average time spent creating a competition from scratch by 40%.
Key Result 1.2: Increase the usage of "Templates" over manual "New Competition" setups from 20% to 70%.
Key Result 1.3: Achieve a 0% failure rate in "Stock/News Database" bulk uploads through improved validation UI.
Objective 2: Enhance Simulation Precision and Volatility Control
Focus: Ensuring the admin feels confident that the market "behavior" matches their intent.
Key Result 2.1: Increase the number of "Test Simulations" run per competition by 25% (indicating admins are utilizing the new visualization tools to verify volatility).
Key Result 2.2: Reduce "Emergency Live Edits" during active competitions by 30% due to better pre-competition oversight.
KPIs:
Task Success Rate (TSR) Goal: 95%
Time-on-Task (ToT) Goal: 50% Reduction
Error Rate per Setup Goal: < 1.5 Errors per session
Template Adoption Rate Goal: 75%
The New Template
To address the friction in competition setup, I focused on transforming the administrative experience from a complex data-entry task into a strategic chart. The centerpiece of the solution was a global market overview, allowing administrators to previsualize stock movements and volatility at a glance to ensure the simulation’s difficulty matched the students' level.
Discovery & Strategy
The process began with a deep-dive discovery phase. I facilitated stakeholder meetings to synthesize admin feedback, specifically targeting the friction points in the "Create Template" workflow. By mapping out the rules and technical constraints for the new customization features, I established a clear framework for how the stock price effects would behave within the existing engine.
Iterative Design & Validation
Lo-Fi Wireframing: I developed low-fidelity wireframes to map out the new dashboard and form structures. This allowed for early technical validation with the engineering team, ensuring that all proposed enhancements resided primarily in the front-end to optimize development resources.
High-Fidelity Prototyping: I translated validated wireframes into a high-fidelity prototype, introducing a centralized visualization tool for market trends.
User Testing: The prototype underwent rigorous testing with real administrators. Their feedback was instrumental in refining the granular controls for stock price "triggers."
Hand-off & Implementation
Following iterative refinements, I delivered a comprehensive design spec and interactive prototype to the developers and QA team. This collaborative hand-off ensured that the final implementation was pixel-perfect and that the new "previsualization" logic aligned perfectly with the live simulation engine.